Following a comprehensive review of existing ID physician compensation data, comparative data from other specialties, and industry trends, the Physician Compensation Task Force developed and administered a supplemental compensation survey last spring to the IDSA membership.
The goal of the survey was to gather additional, targeted data to further define and clarify the relationship between ID physicians’ services and compensation received. Specifically, the survey aimed to better define a “1.0 FTE” in actual hours worked; identify compensation plans across employment settings; determine annual compensation and percentage of compensation tied to incentives (quality or production); clarify administrative job titles and their allotted versus actual time commitment; and quantify the number of days on services, on average, that is tied to compensation for inpatient availability.
A high-level summary of findings is provided below.
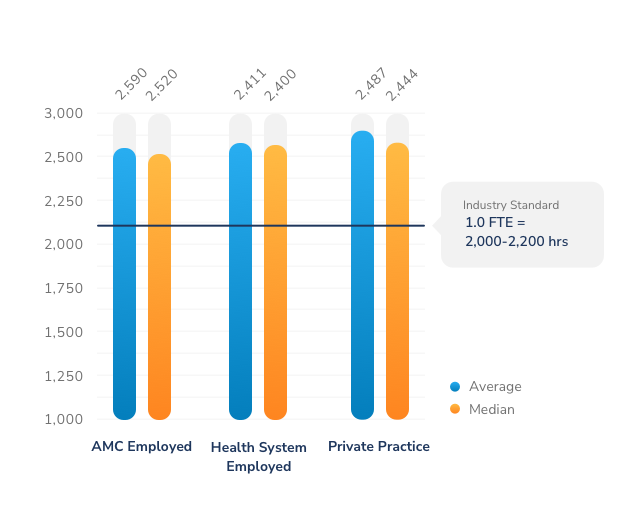
Most full-time ID physicians work more than 2,300 annually. Compared to a standard definition of a 1.0 FTE (2,000 hours), ID physicians at the median appear to be working as much as 30% more than their non-ID peers.
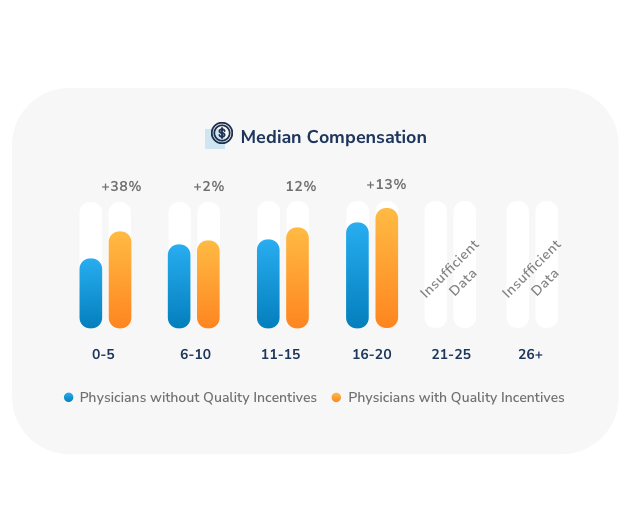
An ID physician incentivized for quality tends to earn more regardless of years of experience, although the impact on compensation decreases as a physician has practiced for 21 years and longer.
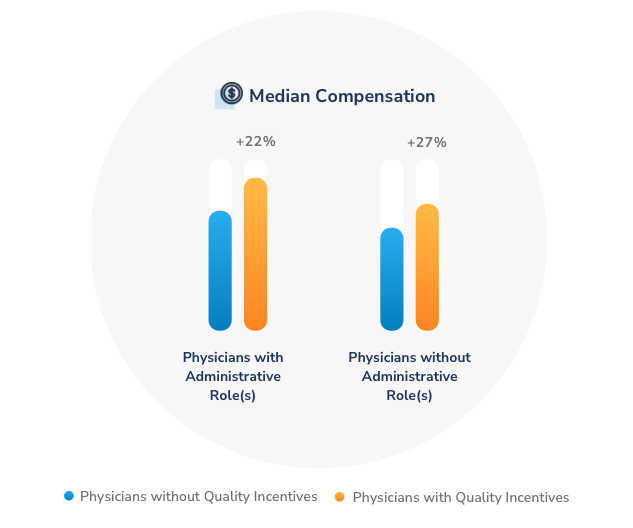
ID physicians with at least one administrative role receive higher compensation than those without administrative roles, although compensation materially increases for those who also have quality incentives.
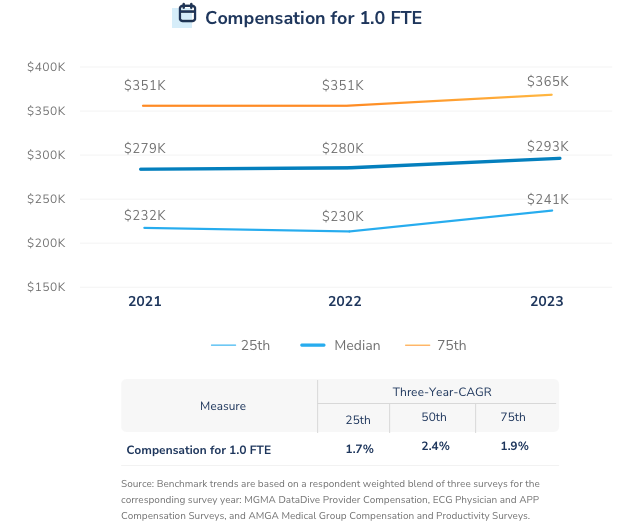
Between 2021 to 2023, the IDSA survey found that median compensation increased by 7.0%, even as measures of both time and production ticked down from pandemic peaks.
Since 2018, both collections per CFTE and collections per WRVU as measured by MGMA, AMGA and ECG surveys have trended down overall.
Consistent with our findings from IDSA’s 2021 survey, the 2023 survey shows the provider and compensation plan attributes that correlate to most directly with higher compensation packages include:
The presence of incentives tied to clinical quality or outcomes
The presence of Incentives tied to clinical production
Formally recognized clinical leadership roles
Physicians covering multiple hospitals when on call
The 2021 and 2023 IDSA surveys found that fewer than half of all ID physicians with an employment contract negotiated their compensation and that most ID physicians have no compensation tied to value.
The 2020-2021 report lists payment for ED Call Coverage Per Diem, Infectious Disease Medical Direction, Infection Control Medical Direction, Clinical Professional Services Hourly Rate, Antibiotic Stewardship Medical Direction, Pediatric Infectious Disease Medical Direction.
The 2018-2019 report lists payments for Infectious Disease Medical Direction, Infection Control Medical Direction, and Antibiotic Stewardship Medical Direction.
MD Ranger is a company that provides benchmarks and analysis on physician contracts; its proprietary database provides information on the specific terms of agreements between health facilities and physicians for emergency call coverage, medical direction, and other leadership positions.
For reports from MD Ranger, "P" stands for "providers" and refers to the number of health care systems on which the report is based; "F" stands for "facilities" and refers to the number of hospital facilities. Therefore, some figures may represent data from several facilities within the same health care system.